Enterprise grade coffee infrastructure monitoring

An essential part of any data centre is a comprehensive monitoring and alerting infrastructure, which enables network and system administrators to respond quickly and correctly to various issues. While such systems monitor most components vital to day-to-day operations, a significant one is often overlooked.
Most NOCs and IT departments simply would not function at all if they don’t have a steady supply of fresh coffee. While high availability configurations using two coffee pots can mitigate the problem of running out of coffee, they can actually introduce latency issues and unnecessary provisioning leading to poor service quality.
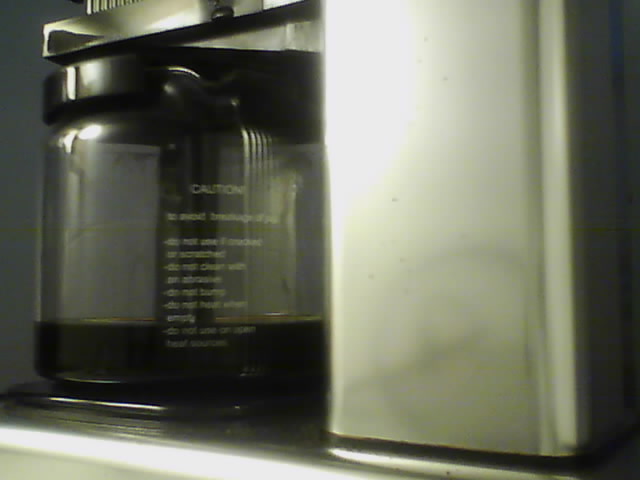
For smaller departments such as ours, the optimal solution is using a traditional single drip brewing system, combined with a monitoring system which measures the pot fill percentage and freshness of the coffee. Our initial solution for this was installing a web camera looking at the coffee pot, thus providing us a continuously updating image on our LAN. While this solution was functional, it only provided a real-time view of the coffee level in the pot and relied on administrators manually keeping note of it.
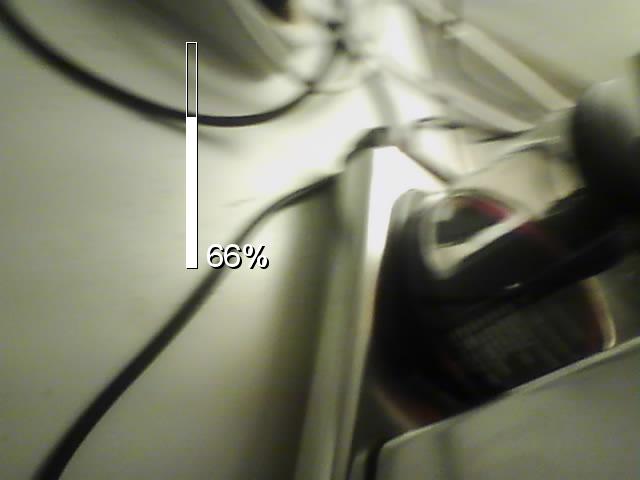
To further develop our solution, we attempted to apply some image processing to improve the machine-readability of the camera feed. By first converting the image to grayscale and then boosting the brightness and contrast, we were able to get a clearly distinguishable edge from the coffee level in the pot. We then chose a suitable area from the image to sample the coffee level from.
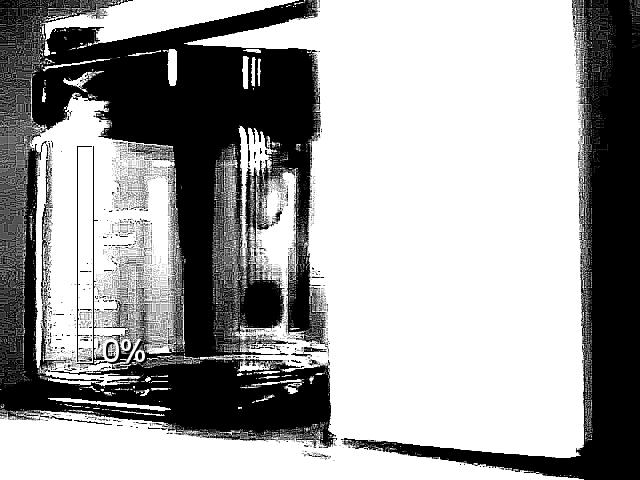
The fill level is sampled independently from each vertical line of pixels and the results are averaged to get the final result. On each vertical line, an 8-bit luminosity value of over 32 is considered to be coffee and third consecutive pixel qualifying as coffee is used as the fill level mark.

Once we were getting reasonably stable measurements, we calibrated the 0% and 100% readings using an empty pot and a freshly brewed one. This was done by adjusting the sampling area and luminosity threshold values.
The measurement is provided both as a user-readable value superimposed over the JPEG camera image and a text-only HTTP response. Using a custom monitoring agent, the fill percentage is fed into our Pandora FMS monitoring system, which records the measurement once per minute. From this data we can derive various metrics that can be used to determine the service quality of our coffee infrastructure.
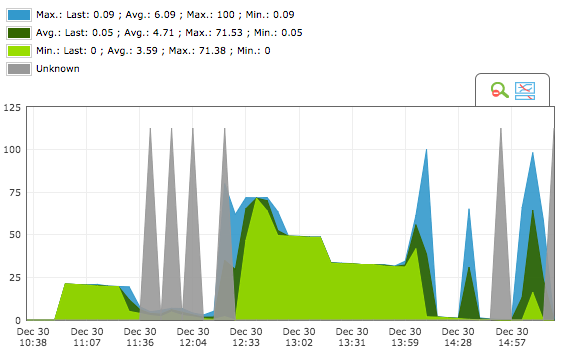
The brewing of a new pot of coffee can be identified from the graph by detecting a steep increase in fill percentage. Typically this means an increase of over 50 percentage points in an interval of less than five minutes. The peak value following this increase is used as the starting time of a new pot.
The starting point can then be used to measure how long the currently available coffee has been standing in the pot. To provide acceptable service quality, a warning is set if the pot is not empty and the coffee in it is older than two hours.
As an interesting note, when a filled pot is sitting on the heated plate in the coffee machine, the slow evaporation of water from the coffee can be seen in the graph as a slow decline of the fill percentage. The evaporation rate appears to be fairly constant regardless of how much coffee is remaining.
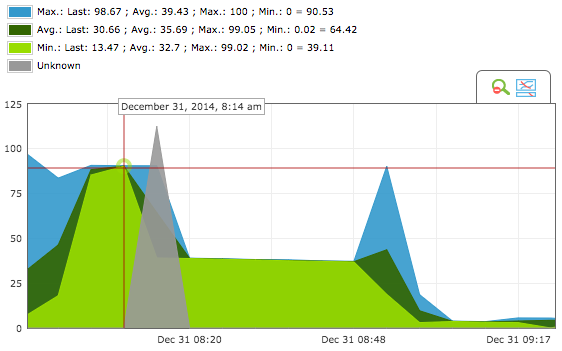
Knowing the volume of the coffee pot - which is mostly of constant diameter - we can use the collected data to measure an average daily coffee consumption by the personnel in our department. This information, along with identifying the hours on when most coffee is consumed, can be used to optimise both the service quality and latency of our coffee infrastructure.
While testing and developing our solution, we did identify a number of scenarions where the measurement can be either inaccurate or impossible. The solution is very sensitive to alignment and calibration issues and as such, someone moving either the camera or the coffee machine will cause incorrect measurements. If the pot is set on the coffee machine so that the black handle overlaps with the sampling area, the system will incorrectly display a 100% fill percentage. We also noticed that people in dark clothes moving behind the pot can cause intermittent false readings.
While this coffee infrastructure monitoring solution is a big improvement over our old one, it still needs some work to improve its reliability. We will therefore continue to develop it and on a later time, publish our results from a longer timespan as well as the source code for our system.